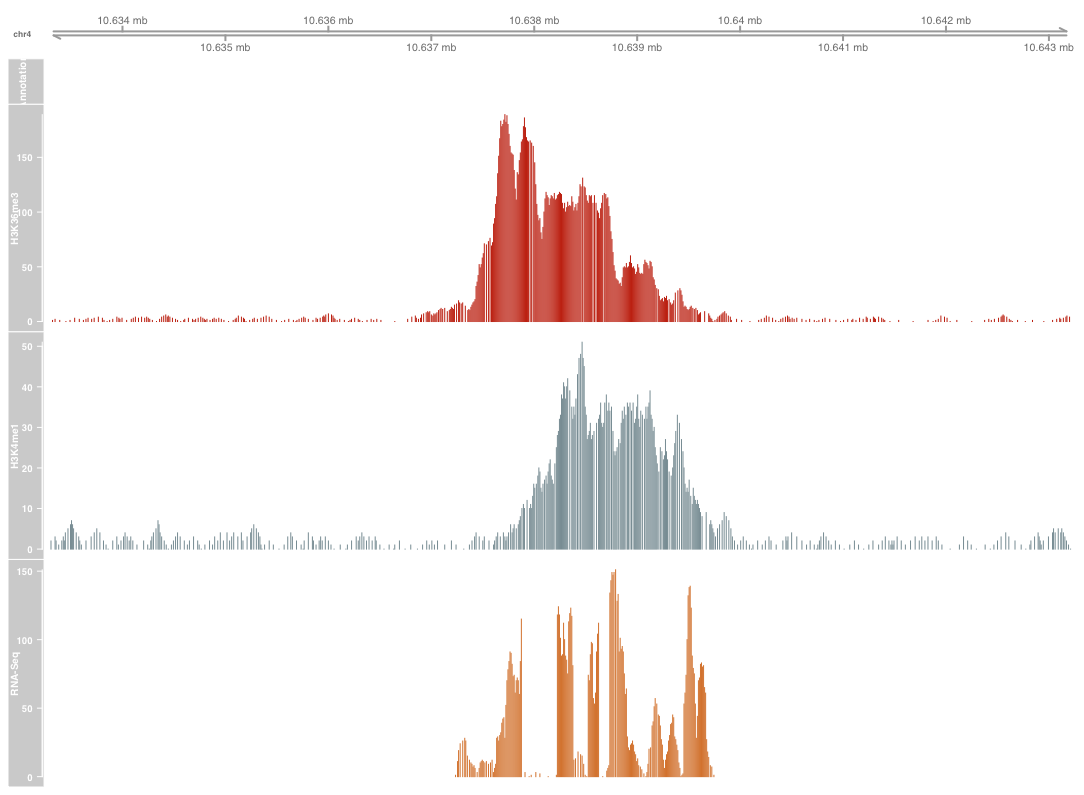
If you’re trying to use both Gviz and cowplot in the same package it can be done. It took me a while, but I eventually found the answer on a combination of a github page/as well as what I presume to be a chinese version of github. So for example - lets say you’re generating the following Gviz image with the follwoing code:
plotTracks(c(axisTrack,grtrack, leaf_H3K36me3_ranges_4, leaf_H4K4me1_ranges_4,
rna_Seq_data_ranges_4), from=10633266, to=10643235, chromosome='4', type="h")
With the output looking like:
You can catch this image using grid::grid.grabExpr() which saves your output as a glob image for later proccessing. So if you’re planning on outputting it to cowplot/combining it with another plot you can do something like
p1 <- grid::grid.grabExpr(plotTracks(c(axisTrack,grtrack,
leaf_H3K36me3_ranges_4, leaf_H4K4me1_ranges_4, rna_Seq_data_ranges_4),
from=10633266, to=10643235, chromosome='4', type="h"),wrap.grobs = TRUE)
p2 <- grid::grid.grabExpr(plotTracks(c(axisTrack,grtrack,leaf_H3K36me3_ranges_2,
leaf_H4K4me1_ranges_2, rna_Seq_data_ranges_2), from=198700931, to=198710900,
chromosome='2', type="h"),wrap.grobs = TRUE)
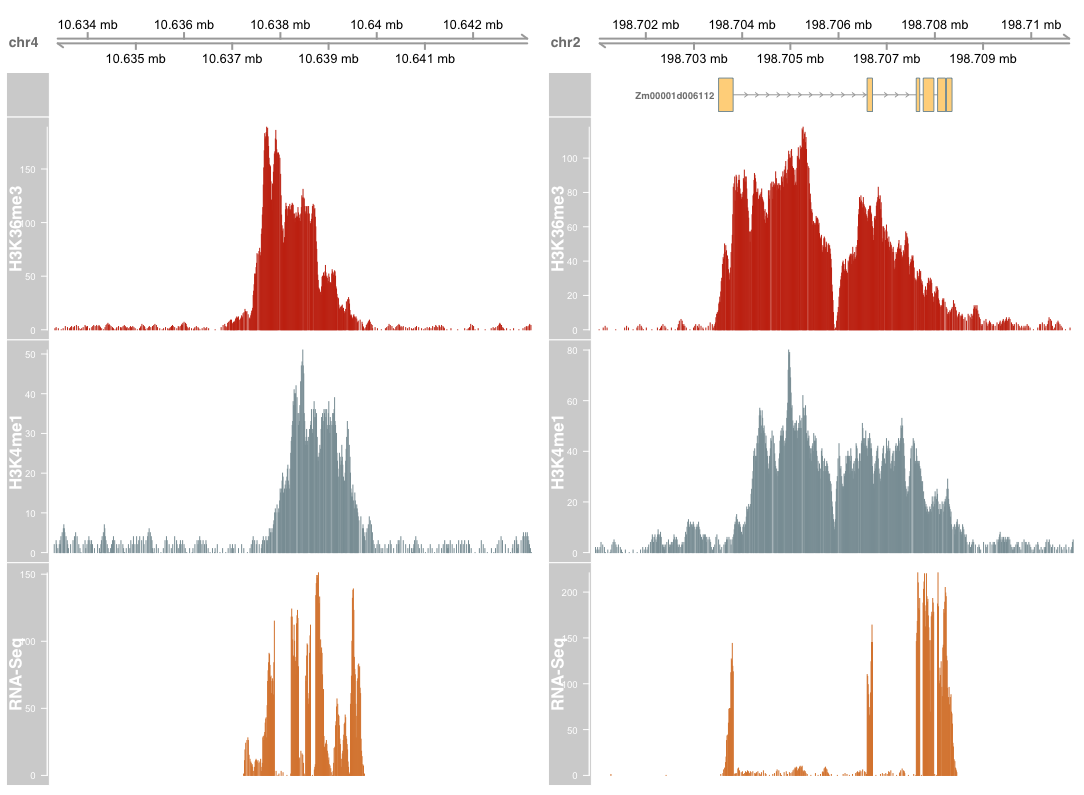
final_figure_1A_plot <- gridExtra::grid.arrange(p1, p2, ncol=2)
Now we’ve combined our two plots, it looks like:
And finally, we take the ‘final’ plot from Figure 1A, and then plot it with the other figures using plot grid using the code below
#Generate Empty plot for Examples
empty_plot <- ggplot(mtcars, aes(x = wt, y = mpg))

final_everything <- plot_grid(final_figure_1A_plot, OTHER_FIGURE, labels = c("A", ""), nrow = 2, ncol = 1, rel_heights = c(1, 1.5))
final_everything
which then makes:
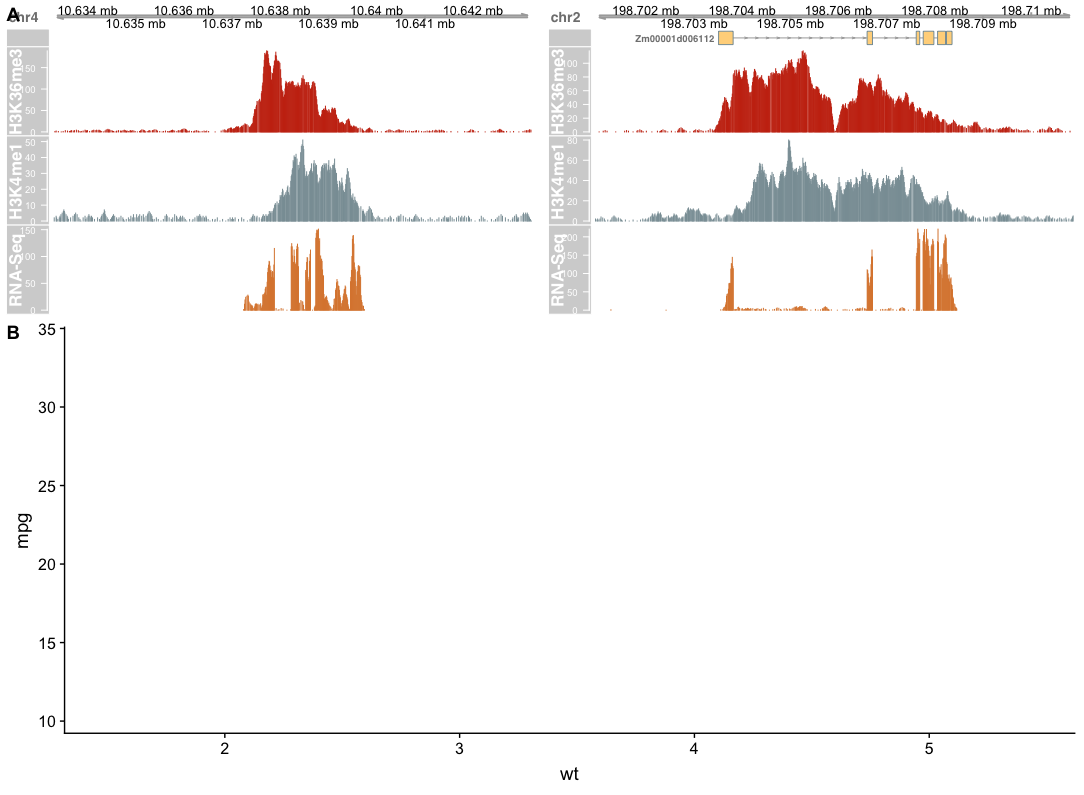
Which will allow you to smack you GVIZ object with other graphs. This little work around single handedly allowed me to avoid illustrator all together! yippie!